科学技術計算 フーリエ変換(パワースペクトル)
Python3(3.10)で動くソースコード(.pyファイル .ipynbファイル)あります
「anaconda3」on .py「PyCharm」.ipynb「Jupyter Notebook」
課題 フーリエ変換(パワースペクトル)
音楽CDのデジタル音声の仕様;サンプリング周波数 = 44.1kHz,
音声のメイン周波数を440Hzとしそれにノイズを付加した疑似信号を入力して
パワースペクトルを描画しなさい.


(2023-11-14)Python3.10で動作確認済み
まず疑似信号をつくる.sin波の式は,
sig = sin(2πft)
である.
「t」はサンプリング間隔ごとの時刻の array である.「sig」はサンプリング間隔ごとの信号の array である.実際にはランダムノイズつまりパワースペクトルでピークが現れないホワイトノイズを付加している.
サンプリング周波数44,100Hzの1/2の22,050Hzをナイキスト周波数という.周波数特性はナイキスト周波数を中心に対称になっている.具体的にいうと,30,000Hzの信号は
44,100 - 30,000 = 14,100Hz
の信号としてパワースペクトルに現れる.
したがって,実際にコードを修正して,次のコードのように14,100Hzの信号または30,000Hzの信号のフーリエ変換の結果は同じになる.
9
10

15
16
fsig = 440  # Hz:メイン周波数
fsub = 14100  # Hz:ナイキスト周波数を超えていない

sig = np.sin(2 * np.pi * fsig * time_vec) + \
      np.sin(2 * np.pi * fsub * time_vec)
9
10

15
16
fsig = 440  # Hz:メイン周波数
fsub = 30000  # Hz:ナイキスト周波数を超えている

sig = np.sin(2 * np.pi * fsig * time_vec) + \
      np.sin(2 * np.pi * fsub * time_vec)
したがって,実際の機器では,アナログ信号にハイカットフィルタをかけてナイキスト周波数以上を遮断してからデジタルサンプリングしなければならない.
フーリエ変換のコードは簡単に
fftpack.fft(sig)
だけである.
その他の計算は描画プロットためのパラメータを算出している.描画プロットのコマンドはWebの例をコピペしただけである.何も修正していないのでそのまま使える.
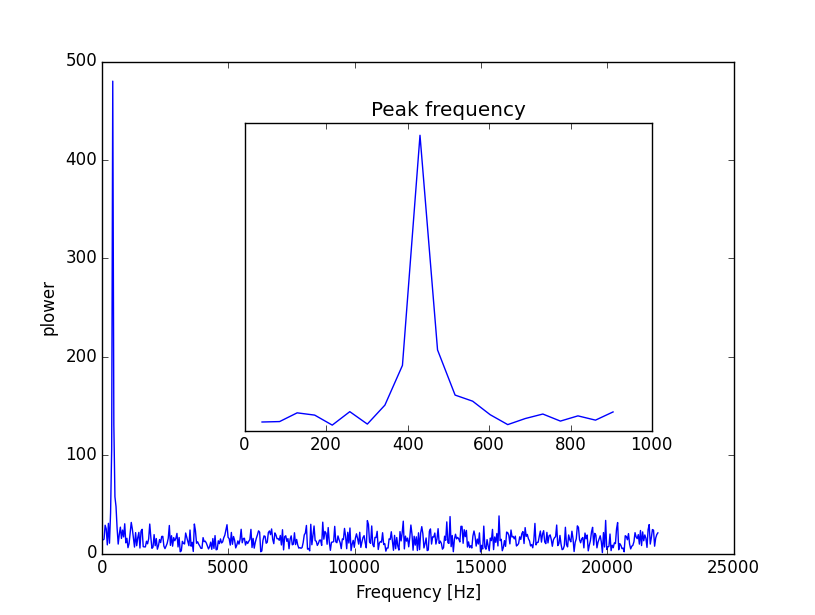
パワースペクトルの横軸はナイキスト周波数22,050Hzまである.メイン周波数440Hzは左隅になってしまっている.そこで小窓を用意しメイン周波数付近を拡大している.
3番目の図は入力信号に窓関数のフィルターをかけたものである.窓関数の代表的なものは,ハニング窓とハミング窓があるが,この例ではハミング窓を使っている.この例では窓関数の有無でそんなに差異がない.
パワースペクトルからノイズを除去してからフーリエ逆変換したものが2番目の図の太線である.ほぼsin波に近いと考えらえる.それに元の信号を重ねてある.
実際の機器では,パワースペクトルは1秒間に数回更新されるものである.この例では約0.02秒,サンプル数で1024であるがもう少し長い方がいいかもしれない.
余談ですが:音階の基準音は440Hzです.ピアノではA49(米式A4;ト音記号の1度上のイ)になる.これは国際会議で決められたものですがクラシック音楽では442Hzが採用されることが多いそうです.ベルリンフィルとかウィーンフィルでは444Hz~446Hzになるそうです.
さらに余談ですが:ピアノの調律師は基準音440Hz,442Hzなどの音叉を持っています.ですがなぜかA37(米式A3)の220Hzから調律を始めるそうです.音叉は倍音になるのですがその方が聴き分け易いのですかね?どこかのWebでA37を440Hzに合わせると誤解された人がいましたがそんなことしたら弦がぶっ飛びますよ.周波数が倍になったらテンションも倍ですよ.
ちなみに,Aは音名ABCDEFGのAであり,日本語では,イロハニホヘトのイになります。ハ長調では音階のラになります(音名ハが音階ドになるから)。
◆◆ソースコード◆◆
このWebページの左上隅からダウンロードできます。
ソースファイルは2つです。
・fourier_transform.py;フーリエ変換の計算・描画
・fourier_transformNiquist.py;フーリエ変換の計算・描画(ナイキスト周波数超が含まれる)
【fourier_transform.py】
1
2
3
4
5
6
7
8
9
10
11
12
13
14
15
16
17
18
19
20
21
22
23
24
25
26
27
28
29
30
31
32
33
34
35
36
37
38
39
40
41
42
43
44
45
46
47
48
49
50
51
52
53
54
55
56
57
58
59
60
61
62
63
64
65
66
# -*- coding: utf-8 -*-
# Fourier transform
import numpy as np
import matplotlib.pyplot as plt
from scipy import fftpack, hamming

np.random.seed(1234)

fsig = 440  # Hz:メイン周波数
Nsample = 1024  # :サンプル数
samplerate = 44100  # Hz:サンプリング周波数
time_step = 1. / samplerate  # sec:サンプリング間隔
# 疑似信号sigをつくる
time_vec = np.arange(Nsample) * time_step  # sec:サンプリング時刻(1024回分)
sig = np.sin(2 * np.pi * fsig * time_vec) + \
      0.5 * np.random.randn(time_vec.size)  # :ホワイトノイズ(sin波でもよい)
# time_vec.size = sig.size = Nsample
sample_freq = fftpack.fftfreq(sig.size, d=time_step)  # Hz:フーリエ変換の横軸
sig_fft = fftpack.fft(sig)  # フーリエ変換
pidxs = np.where(sample_freq > 0)  # プラスだけ抽出
freqs, power = sample_freq[pidxs], np.abs(sig_fft)[pidxs]
freq = freqs[power.argmax()]  # Hz:ピーク周波数抽出

Nwide = 21
plt.figure()
plt.plot(freqs, power)
plt.xlabel('Frequency [Hz]')
plt.ylabel('plower')
axes = plt.axes([0.3, 0.3, 0.5, 0.5])  # ピーク周波数部分を拡大
plt.title('Peak frequency')
plt.plot(freqs[:Nwide], power[:Nwide])
plt.setp(axes, yticks=[])

plt.show()

sig_fft[np.abs(sample_freq) > freq] = 0  # ノイズを消してから
main_sig = fftpack.ifft(sig_fft)  # 逆フーリエ変換

plt.figure()
plt.plot(time_vec, sig)  # 元の信号
plt.plot(time_vec, main_sig, linewidth=3)  # ノイズを消した信号
plt.xlabel('Time [s]')
plt.ylabel('Amplitude')

plt.show()

# 窓関数
win = hamming(Nsample)  # ハミングウインドウ
sig_win = sig * win  # 窓関数フィルター

sample_freq = fftpack.fftfreq(sig_win.size, d=time_step)
sig_fft = fftpack.fft(sig_win)
pidxs = np.where(sample_freq > 0)
freqs, power = sample_freq[pidxs], np.abs(sig_fft)[pidxs]
freq = freqs[power.argmax()]

plt.figure()
plt.plot(freqs, power)
plt.xlabel('Frequency [Hz]')
plt.ylabel('plower')
axes = plt.axes([0.3, 0.3, 0.5, 0.5])
plt.title('Peak frequency')
plt.plot(freqs[:Nwide], power[:Nwide])
plt.setp(axes, yticks=[])

plt.show()